
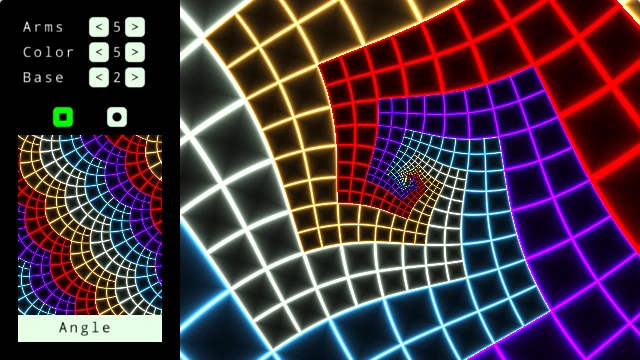
I wrote an interactive shader that performs a sequence of complex logarithm/exponentiation on “Droste Images,” resulting in images becoming self-connected; see 3Blue1Brown and my previous post for more detailed information. M. C. Escher intuited this process when creating his image “Print Gallery.” This post, however, is strictly about my updated shader.
The “main image” is a Droste image, an image that is embedded within itself. In the image below, this main image (in red) is the majority of the screen, and the Droste image is just a grid within a grid within a grid within… forever.
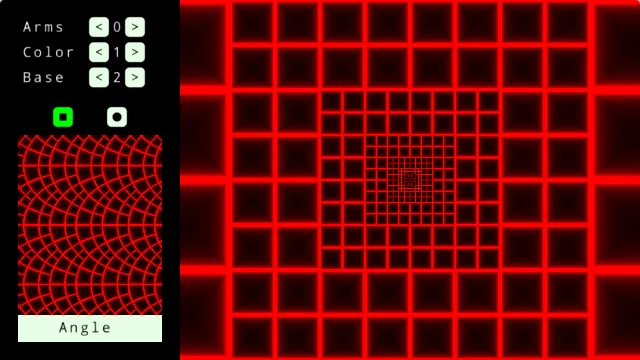
The smaller image on the left/bottom half is a complex logarithm of the main image as described by 3Blue1Brown.
The remaining UI is as follows.
1.) Arms (Top Left): Selects the number of “arms” you can see. In the original shader, there was a single button you could press that would make the image the same geometry as Escher’s “Print Gallery.” This is equivalent to having 4 “arms.” What is an “arm?” See the animated gif. In short, it’s the connectivity various depths of a self-embedded image has with itself. This is much more obvious when you ALSO color the depth of the droste image…
2.) Colors (Top Left): Selects the number of alternating “colors.” This alternates the colors of each Droste image. Then, when you create any number of arms, you can see the connectivity of the embedded Droste images as colors matching or not matching.
That is, if I alternate the color of each Droste Image as, say, red and yellow, then at arms=0 we have a red box surrounding a yellow box surrounding a red box surrounding… forever. Then, if I make arms=2, it connects all the yellow boxes and all the red boxes.
3.) Base (Top Left): How many times do I linearly subdivide the image I’m looking at, and therefore how much smaller would a subject be within each embedded Droste Image.
4.) Droste Image type (Green, square/circle button on left): Grid or Circles. I wanted to see how various shapes transformed, so I allowed the user to look at self-embedded grids along with self-embedded circles.
5.) (Click and hold on images/Angle Button): You can also manually zoom in and out, as well as manually rotated the complex logarithm and zoom it in and out for trippy results.
Anyway, I decided to post this as a public shader on shadertoy and to show it to people on the 3Blue1Brown subreddit and also post it here in the event anyone wants to play with it! Note that it will not work on your phone 🙁 The shadertoy API only works with mouse input. That said, I hope you enjoy!